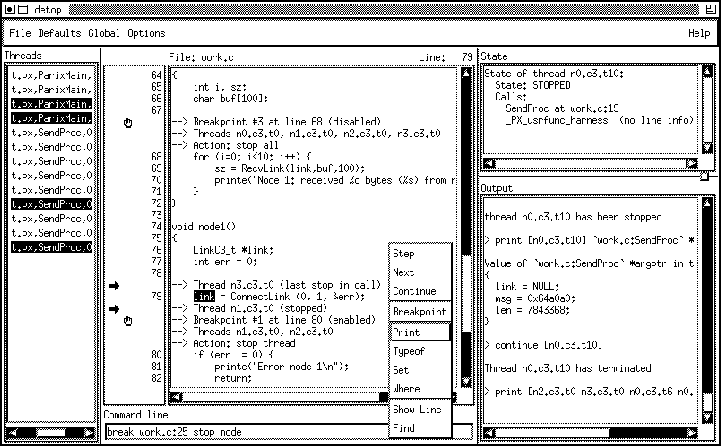
Figure 2: A sample debugger window
THE DEBUGGER will provide support for the efficient source level debugging of distributed programs written in C or Fortran 77. In contrast to other projects it is not a simple interface built around a sequential debugger, but a real parallel debugger with special support for PVM.
Of course, THE DEBUGGER offers a comfortable graphical interface. It is based on a debugger window showing the source code and command output (see Fig. 2). In addition, visualizers for regular and also irregular data structures will be provided. The debugger window can be associated with an arbitrary set of tasks that is displayed in the list at the left side. All debugger commands, e.g. single-step, set breakpoint or print, are applied to all these tasks or a selectable subset, so data parallel programs where all tasks execute roughly the same code can be examined using a single window. Multiple windows can be used to debug groups of tasks executing different codes.

Figure 2: A sample debugger window
Besides the flexible user interface, THE DEBUGGER provides a variety of other features essential for parallel programming. We will discuss only the most important ones here. First of all, PVM is fully supported. THE DEBUGGER can be used for heterogeneous environments and allows to inspect PVM objects like a task's incoming message queue or a barrier's task queue. Tasks can be identified not only by their ID, but also by additional information, such as host, file and group names or parent task. Based on patterns using this information, dynamically spawned tasks can be automatically stopped at the beginning and may be added to any debugger window.
Second, THE DEBUGGER uses the event-action paradigm instead of a simple breakpoint scheme. Events which may be parameterized, represent special conditions in the program, e.g. 'task reaches a source line', 'message is received' or 'new task has been spawned'. Each event defined can be associated with a list of actions that are executed when the event occurs. Actions include stopping any set of tasks, tracing the event, printing variables or defining new events and actions. Since actions are evaluated autonomously by the distributed monitoring system without interaction with the debugger's front end or the user, intrusion is kept very low. Furthermore, actions may also be triggered by events on remote hosts, so global halting and distributed breakpoints are possible. We will also provide special breakpoints allowing to follow message transfers: when a task sends a message, the breakpoint will stop the receiver immediately after it has received that message, so data processing can be watched across task boundaries.
Finally, THE DEBUGGER will be integrated with THE DETERMINIZER and THE CHECKPOINT GENERATOR, making cyclic debugging practical. Parallel programs usually run for a very long time, so re-running them becomes a tedious job. In addition, program behavior may not be reproducible due to race conditions. Therefore, a form of backtracking will be provided by generating a checkpoint and saving the debugger's configuration upon user request. The user may then return relatively quickly to that point and re-execute the last part of the program. THE DETERMINIZER will then either ensure reproducible behavior or may enforce a different message ordering, so the effects of race conditions can be examined.