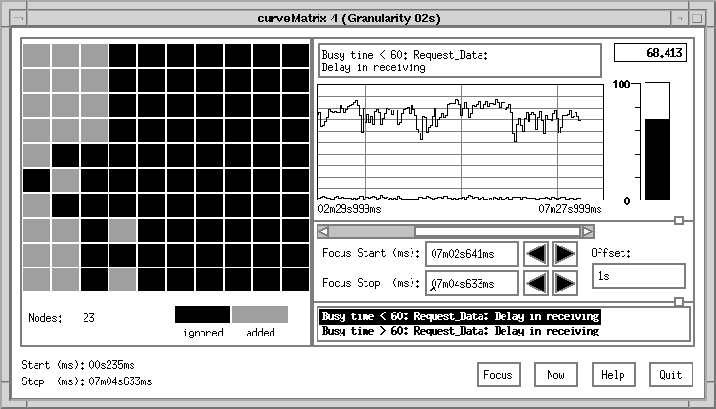
Figure 3: Attributed measurement of our performance analysis tool
THE PERFORMANCE ANALYZER will we able to handle two different kinds of measurements types: online analysis and trace evaluation. Both types offer slightly different functionality and are distinguished by the fact that a trace reflects a fixed program run of the past which includes only a limited amount of measured data. Measures which have not been evaluated during runtime are lost for trace analysis.
Let us have a closer look at the functionality of THE PERFORMANCE ANALYZER. It provides analysis on four levels of abstraction: at the level of the virtual machine (i.e. the set of involved workstations), the node level, the task level, and the function level. Three types of load characteristics can be evaluated: the amount of computation (CPU-time etc.), communication characteristics like number of bytes sent/received and delay in waiting queues, and I/O characteristics (also volume and time based). An investigation of these measures should give the programmer some idea on possibly inefficient constructions in his program. However, with an increasing number of tasks it becomes difficult to detect the nodes of interest. Therefore, THE PERFORMANCE ANALYZER offers special attributed measurements. The nodes which shall contribute to a value are specified via a predicate. If the predicate is not true, their current value is disregarded. Figure 3 shows two specified measurements: One measurement evaluates nodes where the busy time is less than 60%, the other one measures the remaining nodes. The predicates are used to select nodes; the measured data in both cases is delay in receiving. The two curves give the time behavior of these two attributed measures. Currently, specification of predicates has to be done manually. In future, we will think about methods of how to add some automatism, e.g. by stepwise strengthening user-defined predicates in order to minimize the set of interesting nodes. By having identified nodes with unusual behavior it would be possible to automatically start a refinement of performance analysis.

Figure 3: Attributed
measurement of our performance analysis tool
Attributed measurements not only make it easier to find bottlenecks but also improve the scalability of the tool. Especially with a higher number of nodes or tasks this feature can reduce the amount of information that has to be displayed on the screen. In contrast to other tools we are therefore able to handle sets of a hundred nodes and more.
Apart from offering current values, mean values, and a graphical representation of values changing during runtime THE PERFORMANCE ANALYZER will support enhanced statistical functionality. This will cover aspects like minimum and maximum values, statistical distributions of values over the time-axis, and may-be user definable combinations of primitive performance measures. By means of that it should be possible to perform more application oriented measurements, e.g. mean number of seconds per iteration in a numerical algorithm.
Finally, THE PERFORMANCE ANALYZER will support the program dynamics of PVM. Not only will it be possible to handle a dynamically changing set of active workstations, but also to evaluate the positive or negative influence of load balancing. This will be achieved by a monitoring system which informs the tool about every change of the current process graph.